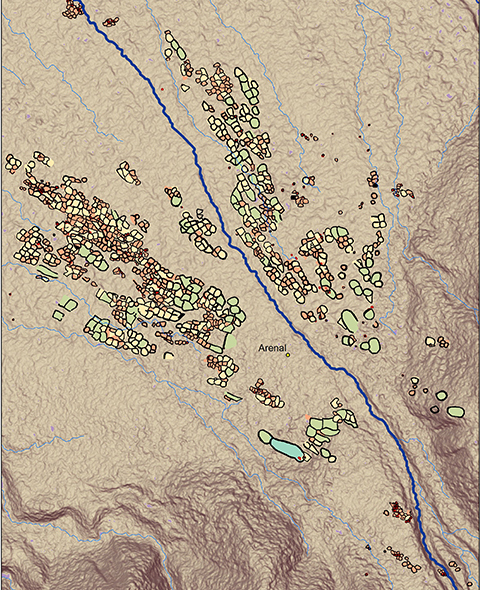
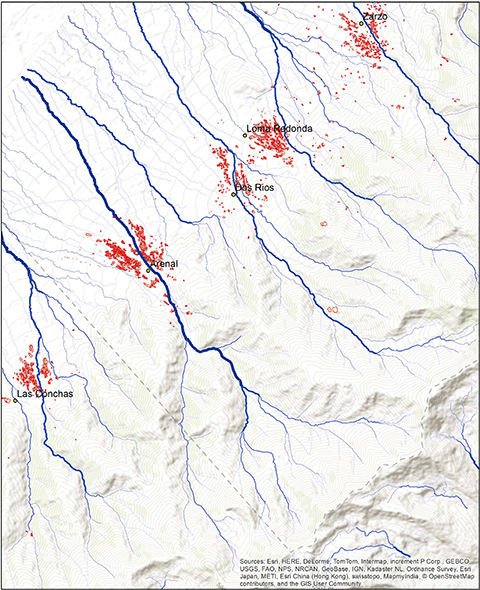
High resolution satellite imagery is being used as part of this project to produce a full-coverage integrated spatial dataset within an E-W transect located at the southern sector of the Calchaquíes valley area of Northwest Argentina, from the El Bolsón valley in the West to the Aconquija Sierra in the East and the surrounding ecotonal areas. The coverage extends to over 8,300 square kilometres, which is the largest mapping exercise of the kind in this part of the world.
Built in ArcGIS, our digital map captures in a flexible and adaptable format, the long-term evidence for settlement, land use, connectivity, and hydrology, from pre-Hispanic times to the contemporary period. Automatic detection and classification, which are typically used when gathering information from satellites, is fast but inaccurate. Instead, we employ visual interpretation and on-screen drawing of architectural remains of settlement farming activities. All are identifiable on a range of satellite imagery capturing the landscape at different moments in time over the past 10 years and at a ground resolution of below 1m. The methodology, which is standardly employed in European archaeology and beyond, has been pioneered by our team using freely available satellite images during a pilot exercise in the Aconquija Sierra in 2019, and separately between 2017-21 in Northern Chile. Under the present project, over 38,000 features have been mapped so far. Most of them are field enclosures and corrals of different size and shape, and date of occupation, but also notable are terraces, irrigation systems, and domestic structures.